How to view a report of Event Sales
Select your event and click on ‘get sales’ to view a report for all sales, alternatively use the date filters to create a report of tickets sold within a specific timeframe.
Once the report is displayed on-screen you will have the option to print or export to CSV.
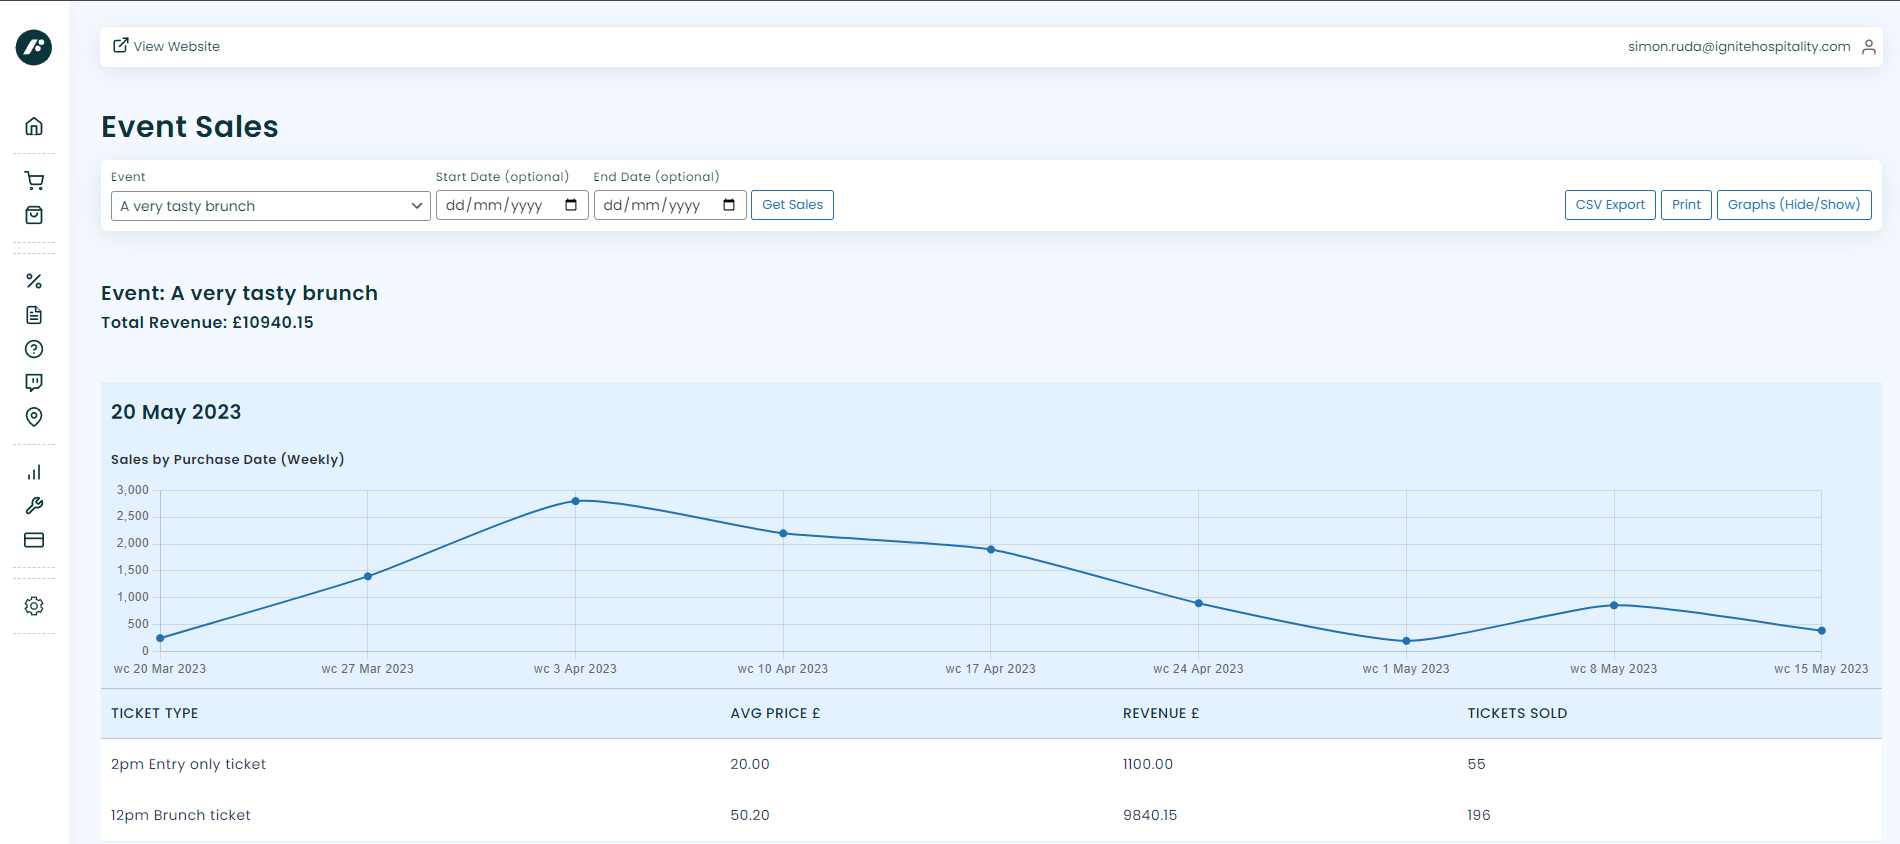
If your event has multiple dates the report will show a graph for each event date, along with a combined sales graph at the top of the report. The dated graphs can be hidden using the toggle button at the top of the report, the combined total graph will always be displayed.
Please note that the graphs will automatically adjust depending on the range of sales dates. For instance if all of the sales displayed are within a 30 day period you will see sales for each individual day. If there are more than 30 days of sales your graph will display weekly totals and if there are more than 6 months of sales the data points will be monthly sales.
Whilst these reports can be viewed at any time through the dashboard there is also an option to receive weekly/monthly reports emailed to you automatically. For more information on setting up automated reports please see here.